
调试篇 | 使用WinDbg Debug(下)
上一篇讲的是远程调试ACPI,这一篇就再写写本机调试和蓝屏文件分析。
本地调试
WinDbg除了使用USB进行远程调试,还可以进行本地调试,此方法对于一些不能使用RW等工具的平台(如高通arm64)就显得非常有用。
被调试的机器同样要打开DEBUG模式,只需一条命令:
bcdedit /set debug on
进入本地调试的方法也很简单,跟USB差不多,只不过选的是Local

经测试,本机调试无法跟踪ACPI,但!amli相关的指令还是可以用的。
此外,除了ACPI DEBUG,WinDbg还支持读写内存,IO,MSR,PCI等,还可以直接对内存数据进行反汇编。要说明一下的是,本地调试的指令同样适用于远程调试。
内存读写
可用d命令显示内存数据,可接访问宽度b(byte),w(word),d(double word),/p表示使用物理地址,如访问0xFFFFFFF0:
可用fp命令写物理地址数据,可接访问宽度b(byte),w(word),d(double word),用法:fp [MemoryType] PhysicalRange Pattern,L前缀可表示16进制数据长度,如写0xd09f0070:
IO 读写
读使用i,写使用o,可接访问宽度b(byte),w(word),d(double word),如访问cmos:

反汇编内存
可用up反汇编物理地址,如反汇编x86 CPU第一条指令的位置0xfffffff0:
访问PCI资源
可用!pci执行pci相关操作,用法:
!pci [Flags [Segment] [Bus [Device [Function [MinAddress MaxAddress]]]]]
参数比较多,主要是看看flag是如何定义的:
Flags
Specifies the level of output. Can be any combination of the following bits:

Bit 0 (0x1)
Causes a verbose display.
Bit 1 (0x2)
Causes the display to include all buses in the range from bus 0 (zero) to the specified Bus.
Bit 2 (0x4)
Causes the display to include information in raw byte format. If MinAddress, MaxAddress, or flag bit 0x8 is set, this bit is automatically set as well.
Bit 3 (0x8)
Causes the display to include information in raw DWORD format.
Bit 4 (0x10)
Causes the display to include invalid device numbers. If Device is specified, this flag is ignored.
Bit 5 (0x20)
Causes the display to include invalid function numbers.
Bit 6 (0x40)
Causes the display to include capabilities.
Bit 7 (0x80)
Causes the display to include Intel 8086 device-specific information.
Bit 8 (0x100)
Causes the display to include the PCI configuration space.
Bit 9 (0x200)
Causes the display to include segment information. When this bit is included, the Segment parameter must be included.
Bit 10 (0x400)
Causes the display to include all valid segments in the range from segment 0 to the specified segment. When this bit is included, the Segment parameter must be included.
如显示所有PCI设备:

将bit0置1可显示详细信息:
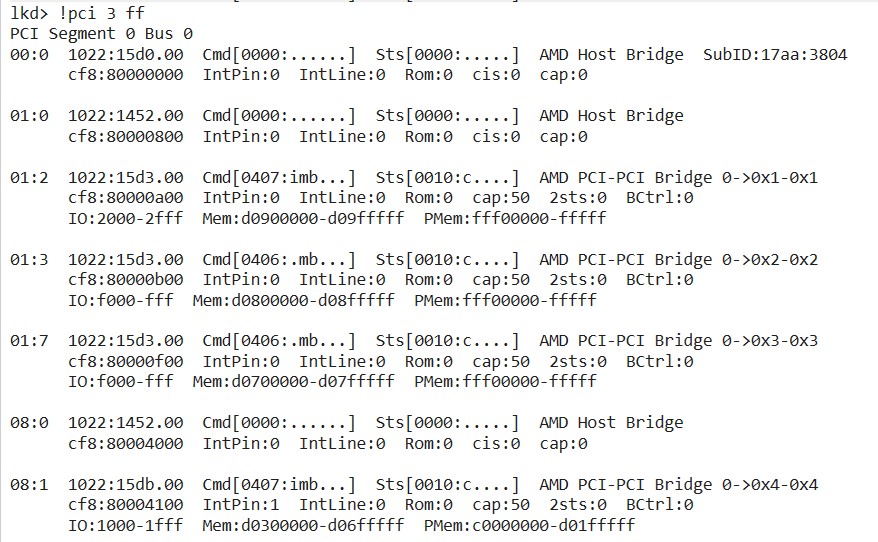
查看bus4, device0, function1寄存器:

其它的就不举例了,具体可看看帮助文档。
蓝屏分析
Dump File
Windows有一个系统错误转储机制,当系统发生致命错误无法继续工作时,系统会把当前内存中的数据保存成文件,记录着蓝屏前系统的状态。转储文件共两份,即Mini dump(C:\Windows\Minidump)和Full dump(C:\Windows\MEMORY.DMP),前者仅包含与进程关联的内存信息,大小一般几兆或十几兆,后者包括一个进程的整个内存空间、程序的可执行映像本身、句柄表和其他信息,文件大小几百兆或几G。
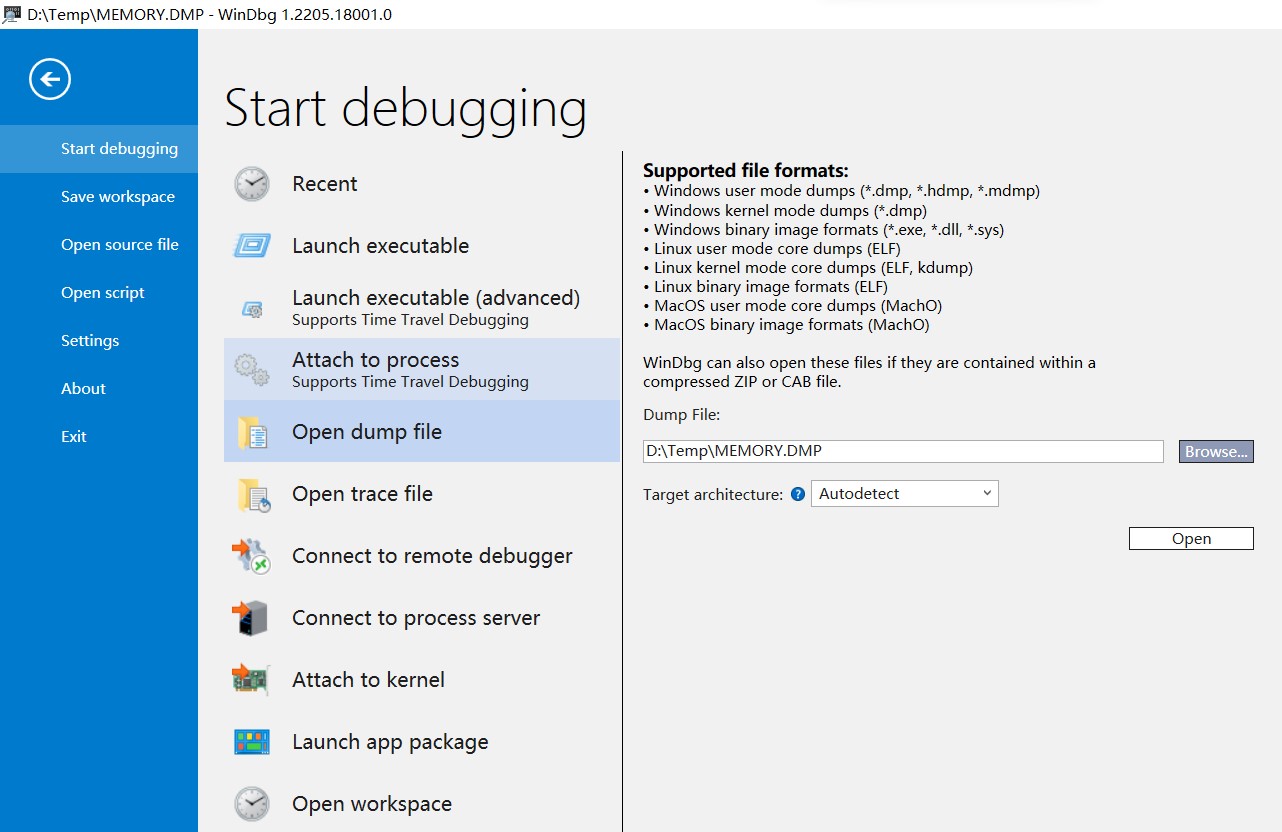
打开Dump File
启动WinDbg,依次点击File, Open dump file,右侧选择DUMP文件,然后点击Open即可开始分析。

用鼠标直接点击蓝色字!analyze -v,便会自动进行分析,期间可能要下载符号文件。最终可看到:

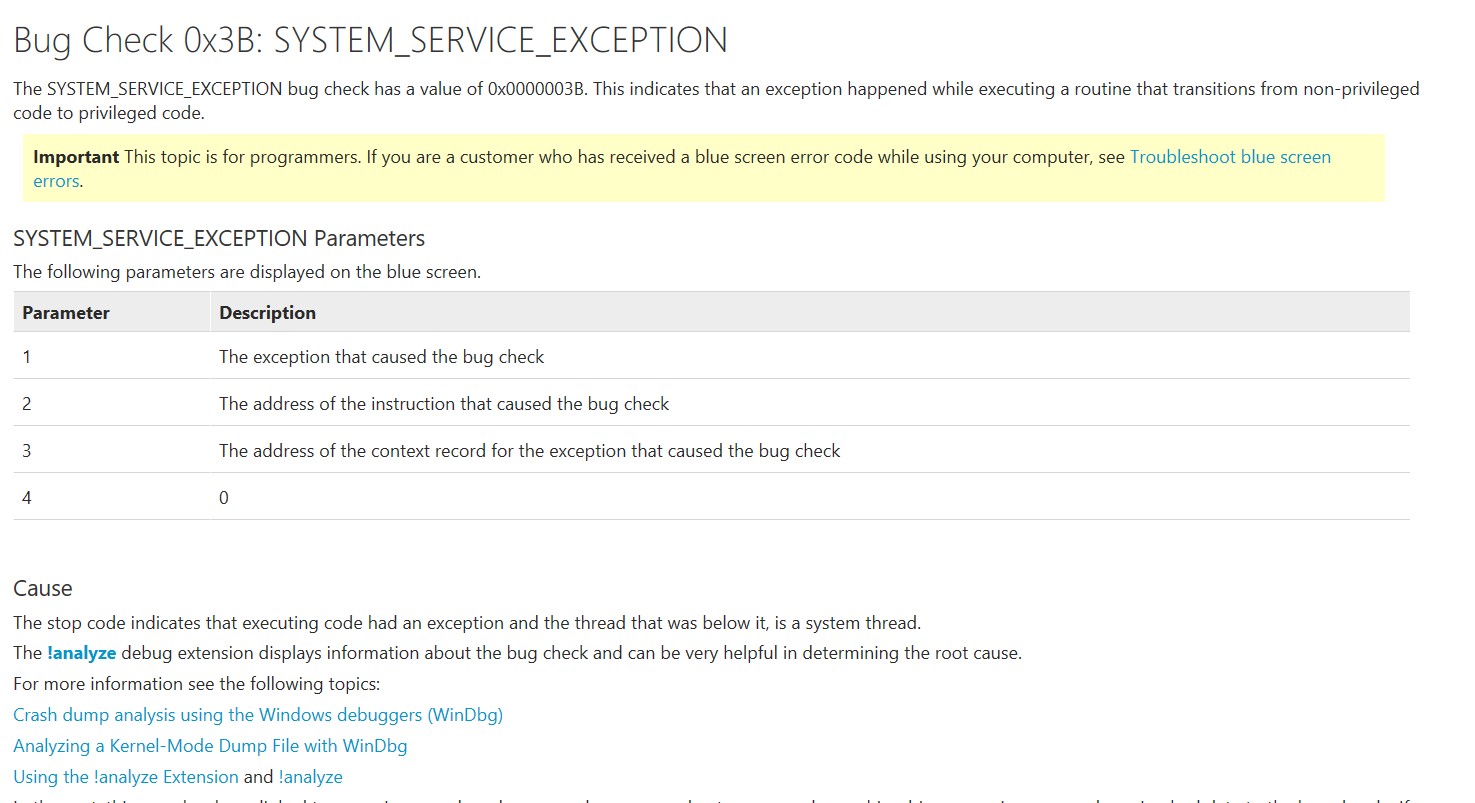
BUGCHECK_CODE: 3b表示蓝屏代码为3b,可在windbg帮助文档找到对应的说明。
接着继续往后看,下图中表示是nt这个模块中的ntkrnlmp.exe调用CcAllocateInitializeBcb这个函数出现蓝屏的。

以上便是简单的蓝屏文件分析过程。
WinDbg是一个强大的调试工具,可以仔细看看帮助文档,发掘更多功能!
版权声明:
作者:bin
链接:https://ay123.net/mystudy/1431/
来源:爱影博客
文章版权归作者所有,未经允许请勿转载。

共有 0 条评论